Building Products Manufacturer
Waterfall Insights to Revenue Growth: Turning Data into Dollars
Utilized cost-to-serve waterfall to identify low margin customers and products driving 8% bottom-line revenue growth
Optimizing Margins: Turning Cost-to-Serve Data into Bottom-Line Growth
A building products manufacturer achieves 8% revenue growth by identifying and addressing low-margin customers and programs.
In a highly competitive market, this building products manufacturer faced the daunting challenge of navigating a complex pricing structure with numerous programs and incentives aimed at growth. Despite efforts to adjust prices in line with raw material cost increases, margins continued to erode due to a mix of high discounts and low-margin customer segments. By consolidating over 250 data files into a detailed cost-to-serve waterfall analysis, the company uncovered hidden inefficiencies and designed targeted strategies to eliminate value leaks. The result? A significant 8% increase in bottom-line revenue and a stronger foundation for sustainable profitability.
Explore More Case Studies
Situation
Complex Pricing Structures Reveal Hidden Margin Challenges
High discounts and ineffective programs left profits stalled despite price increases.
- Highly complex pricing waterfall with many programs and incentives aimed at driving growth
- Raised prices with raw material increase but were not seeing pull-through to margin
- While average discounts had been declining since prior price increases, weighted average discount increased due to customer mix
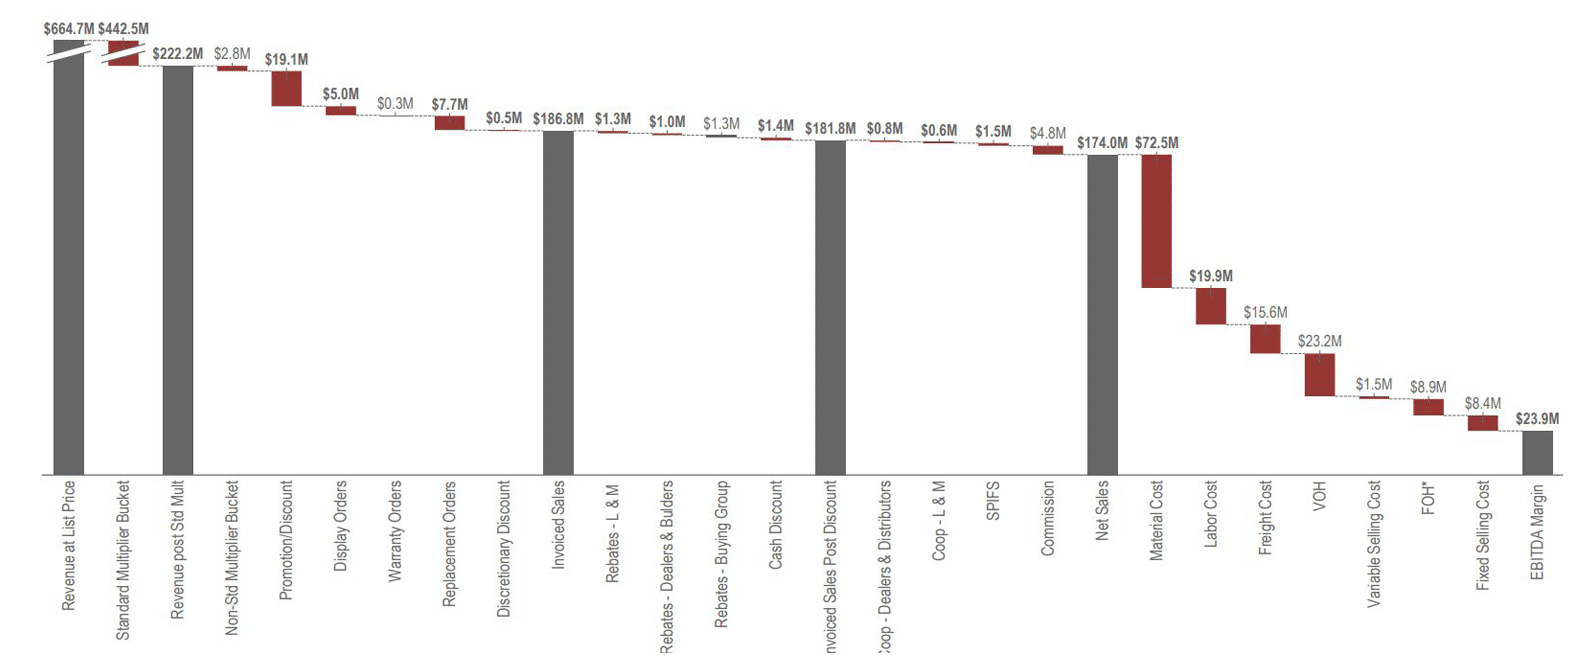
Cost-to-Serve Waterfall
Visualizing profitability: Identifying margin drains and opportunities through cost-to-serve analysis.
Approach
Data-Driven Strategies to Optimize Cost-to-Serve and Drive Profitability
Leveraging transaction-level insights to redesign pricing, programs, and customer policies for sustainable growth.
- Consolidated over 250 data files to build transactional waterfall
- Identified low margin customers and products and compared with peers to identify outlier situations / patterns
- Redesigned programs related to year-end and quarterly rebates, promotions, service levels, freight, and customer discounts
Strategic Pricing Actions and Their Financial Impact
Targeted initiatives to eliminate inefficiencies and improve margins across customers and products.
| Pricing Action 1 | Customer | Description | Revenue | Impact |
|---|---|---|---|---|
| Eliminate National Promotions | Dealers & Distributors | Gradually eliminated all national promotions | $xx | $20M |
| Discount Decreases | Dealers & Distributors | All major product lines had two increases 4 months apart, 3-4% each | $xx | $14M |
| Buying Group Contract Changes | [Buying Group Name(s)] | Updated contract terms | $x | $250K |
| Customer Specific Price Changes | 55 Low-Margin Customers | Price increase for specific product lines by 7-10% | $x | $500K |
| Customer Specific Service-Level Changes | Customers with High or Low Utilization | Sent termination letters; freed up capacity | $x | TBD |
Impact
From Insights to Results: Delivering 8% Revenue Growth
Increased compliance, reduced price leaks, and sustainable profit improvements drive bottom-line success.
8%
Bottom-line revenue growth
Increased sales compliance to policies
Ongoing visibility to price leaks
Unlocking Competitive Advantage: How Competitive Intelligence Fuels Strategic Pricing
Learn how competitive intelligence drives informed pricing decisions and an effective pricing and commercial strategy

Price vs. Volume Tradeoff
Every business, whether selling products or services, faces a familiar dilemma: lower the price to attract more customers or maintain higher prices to protect profit margins.
Professional Services Overview
Does your pricing strategy capture your full value?
4 Steps to Profitably Navigate Tariffs and Mitigate Impact
Organizations impacted by tariffs must proactively implement critical pricing and operational strategies to protect profitability and achieve business goals.