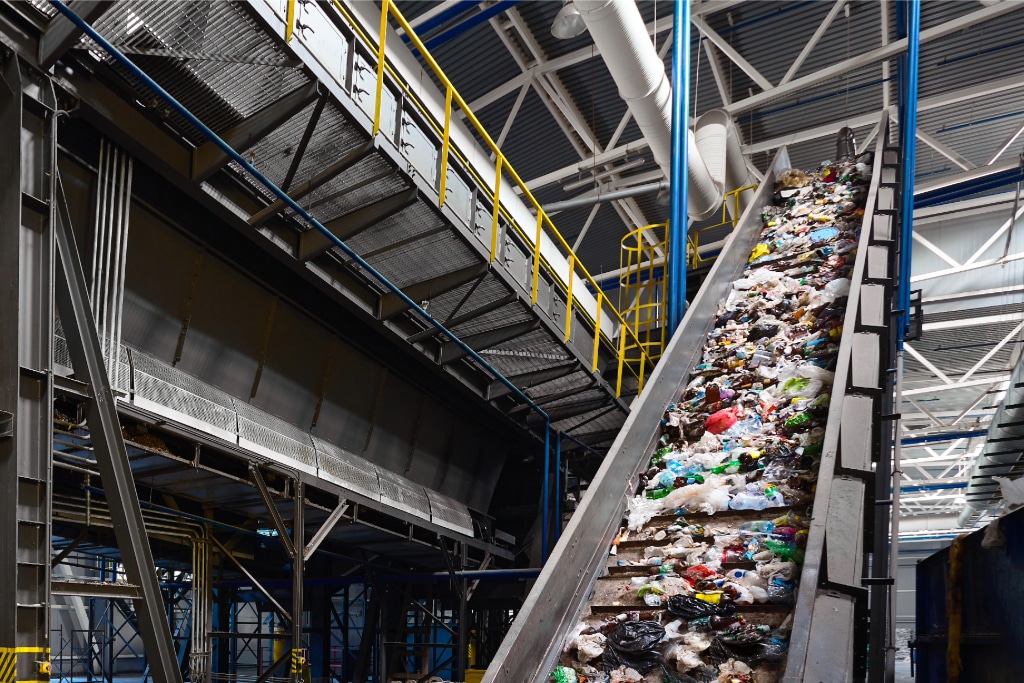
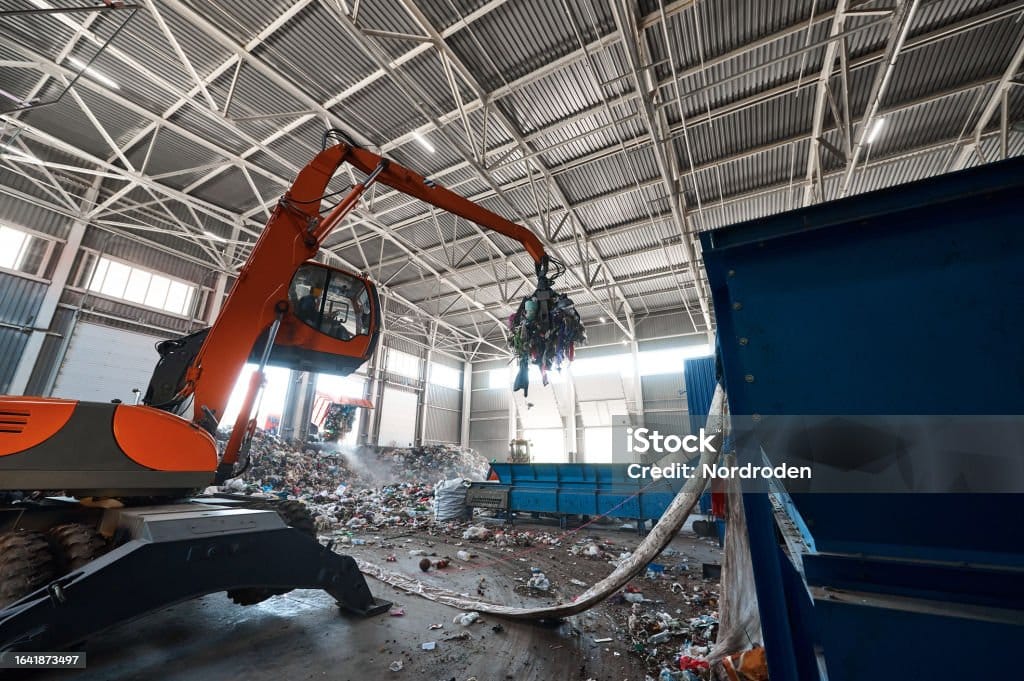
Solid Waste Equipment Manufacturer
How Do My Customers Perceive My Value Versus My Competitors?
Shaping Your Approach for Long-Term Sustainable Success
A clear path to achieving results
The organization faced challenges related to competitor pricing, market share, and brand perceptions, compounded by internal disagreements over the feasibility of implementing back-order price increases and surcharges. To address these concerns, in-depth interviews were conducted to explore customer sentiments on pricing and brand perceptions, complemented by a quantitative phone survey targeting end users to assess price positioning and key purchase drivers. The research revealed an opportunity to implement targeted price increases on existing orders while confirming that the current pricing strategy effectively sustains a strong price-to-value proposition in the market.
Explore More Case Studies
Situation
Strategic Challenges in Pricing, Market Dynamics, and Customer Understanding
- Concerns around competitor pricing, market share, and brand perceptions
- Competing beliefs across the organization around the feasibility and viability of implementing back-order price increases, surcharges, and unforeseen fees
- Limited understanding of the essential factors influencing customer purchase behavior
Quantitative Analysis
Approach
Comprehensive Research on Pricing, Brand Sentiments, and Customer Reactions
- Conducted in-depth interviews to gather primary qualitative research around pricing and brand sentiments and customer reactions to price changes
- Conducted a quantitative phone survey on specific end users to understand price positioning, key purchase drivers, and brand perceptions

Representative Customer Insights
Interview #11
Interview #18
Competitor Rankings
| Client (N=38) | Provider A (N=14) | Provider B (N=60) | Provider C (N=61) | Provider D (N=3) | Other/Provider E (N=4) | Other/Provider F (N=2) | |
|---|---|---|---|---|---|---|---|
| Price | 8.8 | 8.3 | 8.1 | 8.4 | 8.6 | 8.3 | 9.0 |
| Availability/Lead Time | 8.5 | 8.8 | 8.0 | 8.3 | 7.4 | 8.3 | 8.0 |
| Fuel Efficiency | 8.9 | - | 7.9 | 8.9 | 8.0 | - | - |
| Ease of Maintenance | 8.2 | 8.6 | 8.1 | 8.3 | 8.0 | 8.0 | 9.0 |
| Warranty Coverage | 8.5 | 7.0 | 9.0 | 7.9 | 8.0 | 8.0 | 9.0 |
| Manufacturer Brand Reputation | 8.0 | 8.0 | 8.6 | 8.4 | 8.0 | 8.5 | - |
| Product Technologies | 9.2 | 8.0 | 8.2 | 8.7 | 8.3 | 9.0 | 8.0 |
| Safety Features | 8.9 | 8.3 | 8.5 | 8.7 | 8.3 | 9.0 | 8.0 |
| Vehicle Capacity | 10.0 | - | 8.0 | 8.0 | 8.0 | - | - |
| Reliability | 9.5 | - | 8.5 | 9.0 | 9.0 | - | - |
Impact
Strategic Pricing Insights and Opportunities for Value Optimization
- Unveiled opportunity to conduct targeted price increases on existing orders
- Proved that current pricing maintains a robust price-to-value proposition in the market
Key Findings
Strong pricing perception and competitive advantage across metrics